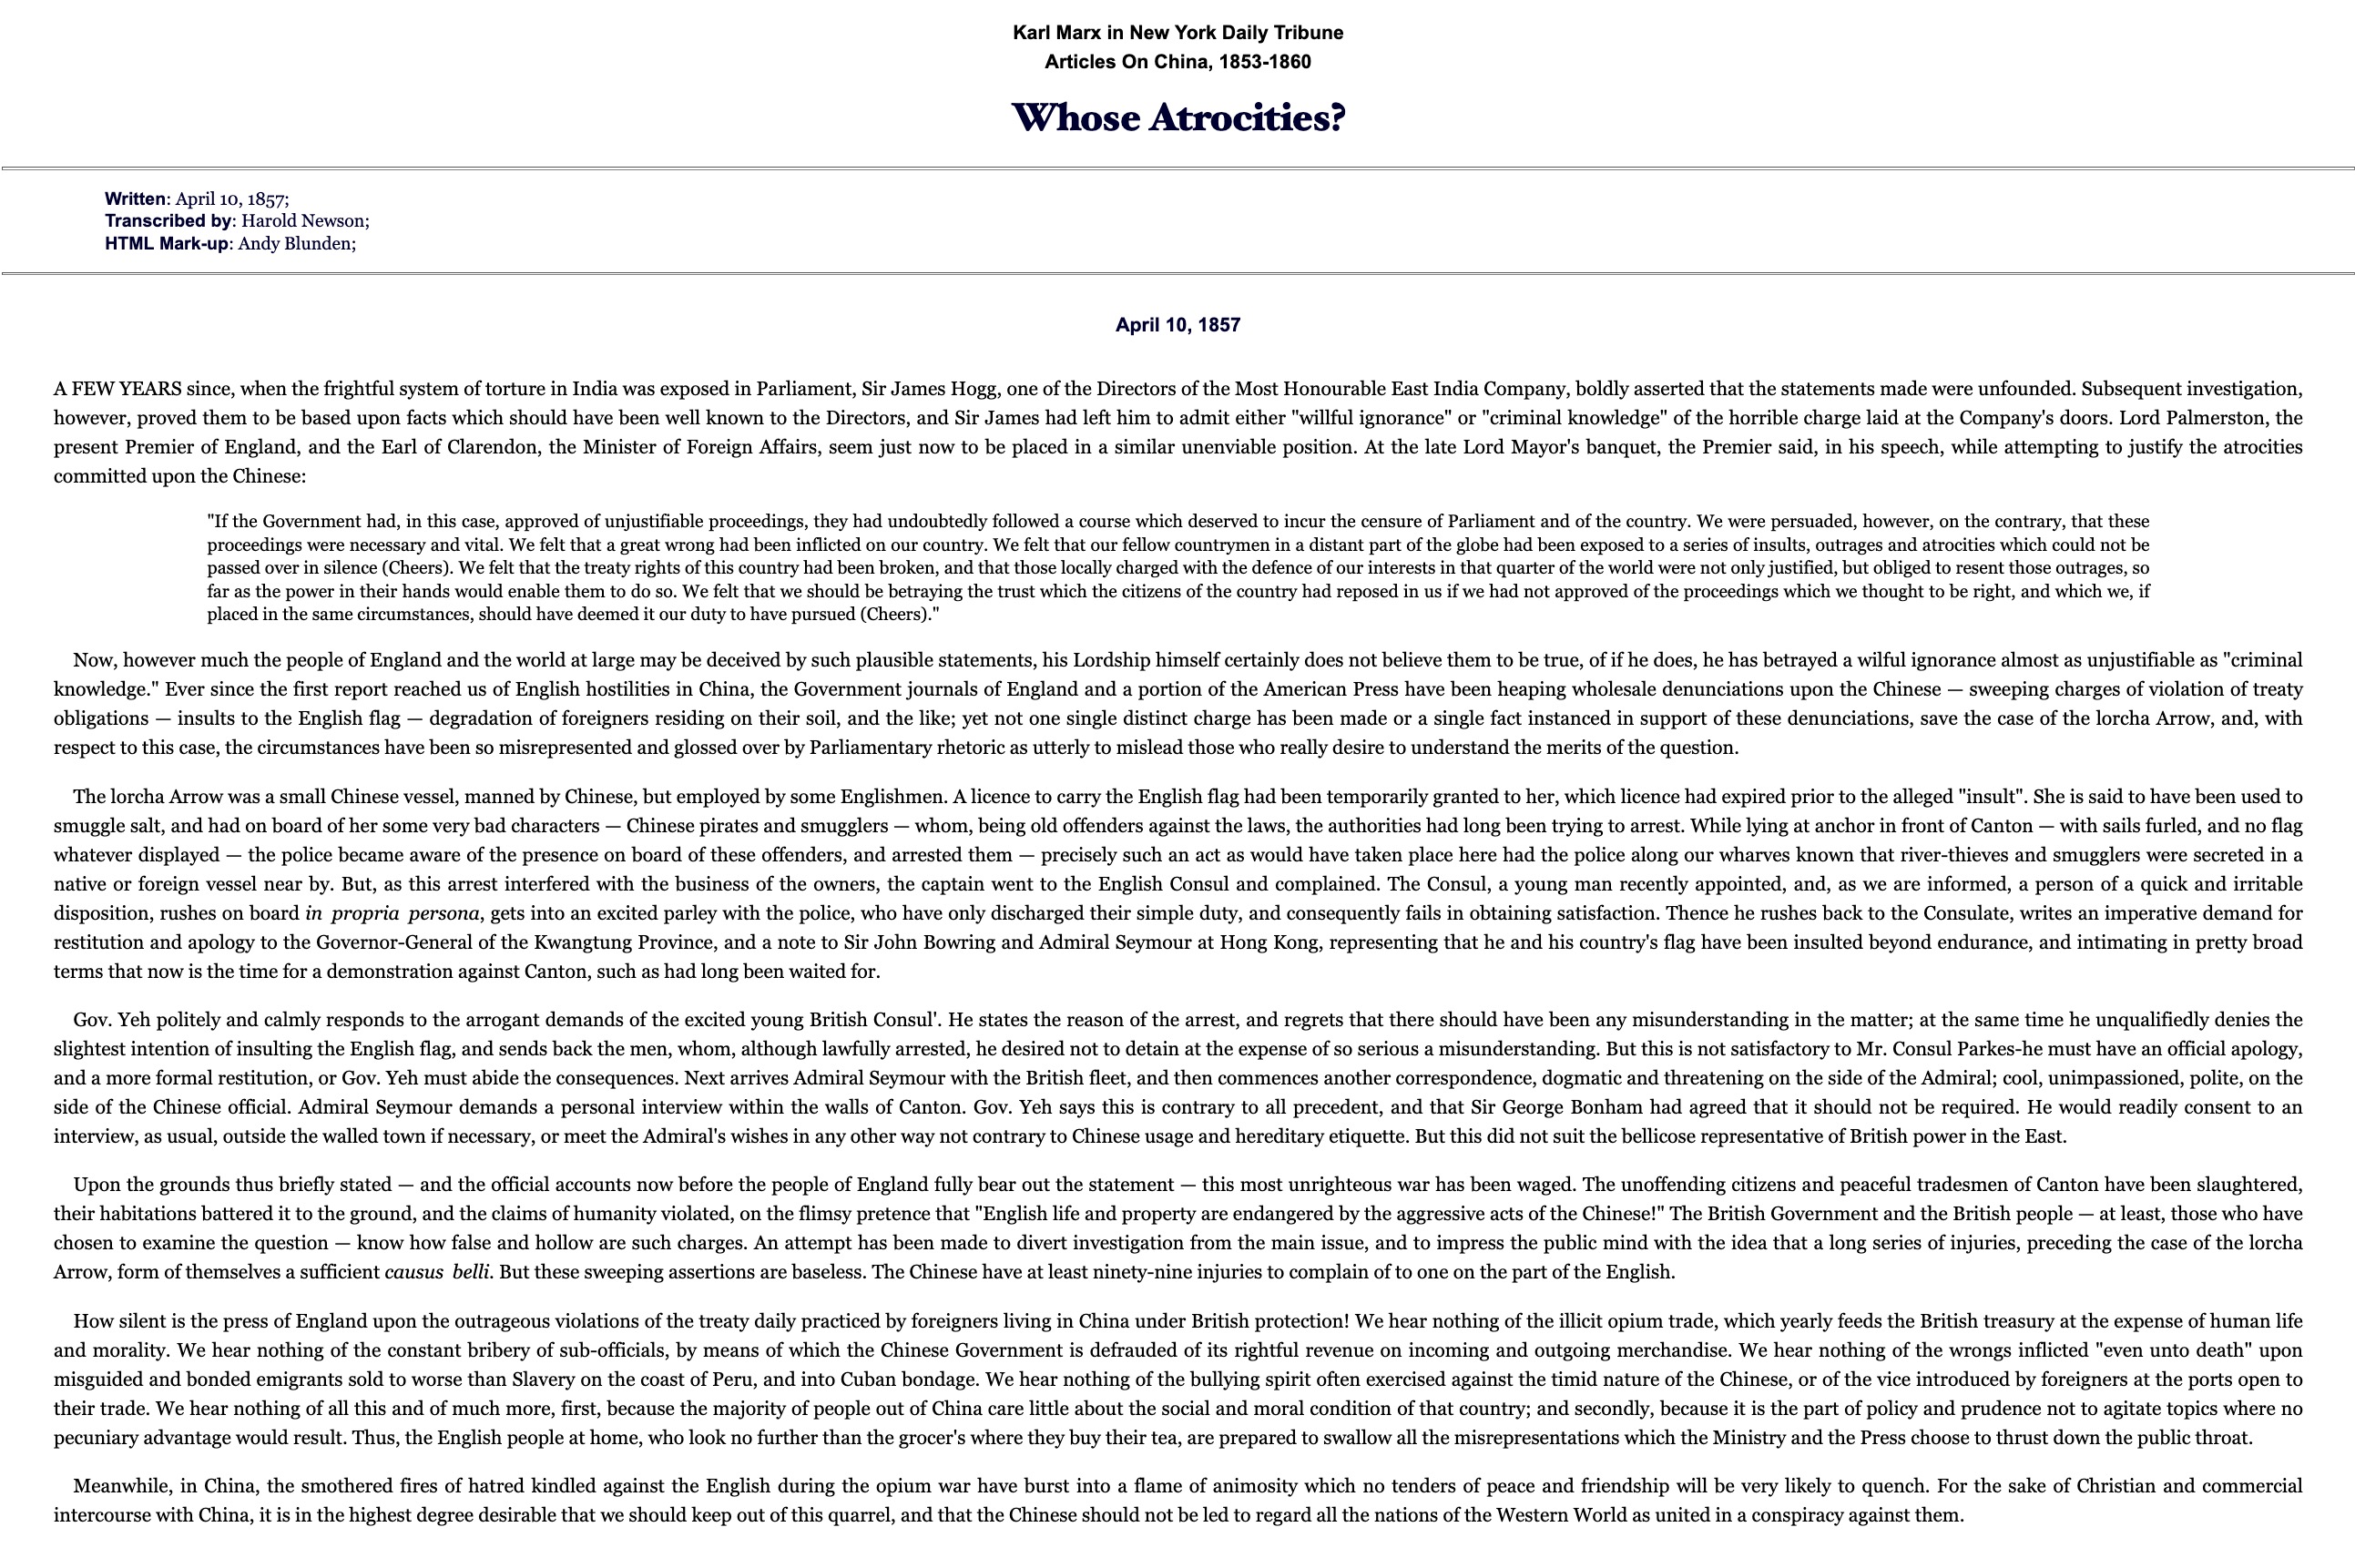
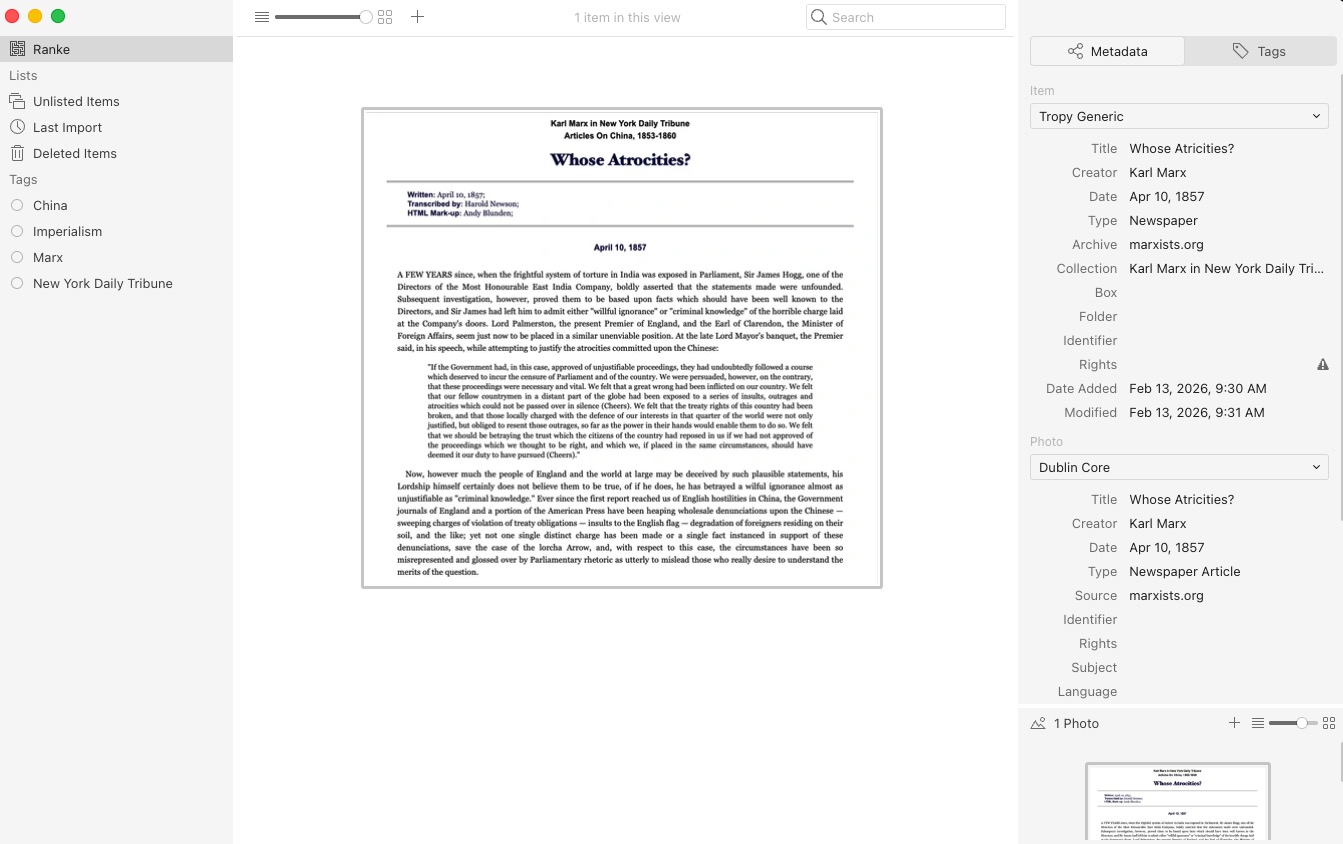
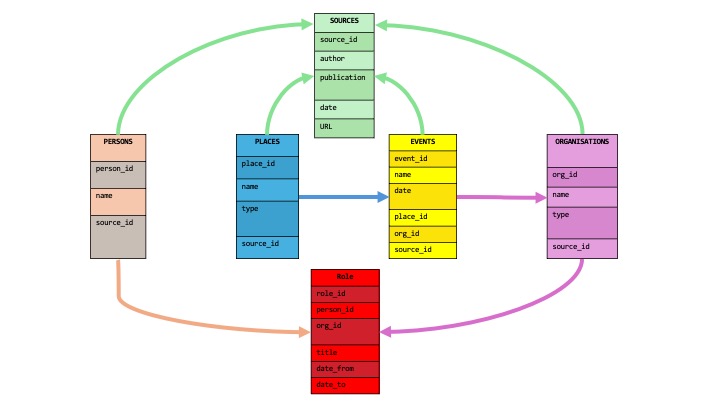
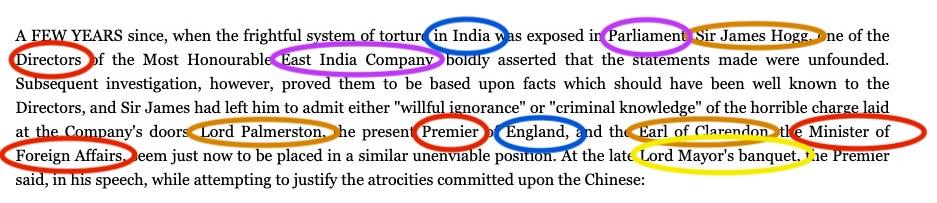
The example below follows a source-centred (or document-centred) design in which each person, place and organisation is connected to the source that mentioned them (via source_id). This approach is used when extracting information from a single document. An entity-centred approach takes the opposite path: the person named Palmerston exists as just one single entry in the table and is linked to all the sources that mention him. This is what happened in the table in 4.c when we decided to include more than just a single article. In most research projects, you will have to use both approaches. When designing your data model, it is important to decide whether the document-centred or source-centred approach is best.
Note that historians are often faced with uncertainty, whether questions regarding facts or doubts as to whether sources are completely reliable in terms of the facts they state as true. We have already encountered two ways to handle this: we can use a set of Boolean flags, as in the example of creating subsets of the entity Place in the form of is_region / is_country / is_city, or a precision label, for example capturing a date (e.g. 1857) and adding a precision label drawn from a fixed vocabulary (for example exact, circa, before, after, unknown). We can employ the same idea of adding a “certainty/uncertainty” label to any value. In the case of a person’s name, for example, we could simply add additional name_certainty column, using lables like confirmed, probable, or disputed to record whether a pseudonym or alias in a source can be confidently attributed to one particular person.
If we create tables for all the different types of information or entities, we could have four tables (five, if the source itself also gets one, here table 1): Person (table 2), Role (table 3), Place (table 4) and Organisation (table 5). We should also have another table for historical events containing all of the entries above. Now the magic happens in the junction tables used to store the relationships (or connectors). Here, there are relationships between people and organisations (as in our table 3) or people and events (our table 7)
Table 1 – Source
Table 5. Table 1 – Source of the database.
Table 2 – Person
| person_id |
name |
source_id |
| P001 |
Sir James Hogg |
S001 |
| P002 |
Lord Palmerston |
S001 |
| P003 |
Earl of Clarendon |
S001 |
Table 6. Table 2 – Person of the database.
In a relational database, Palmerston exists exactly once as row P002. Every event, office or source that mentions him simply stores P002. You can then ask questions that cut across all your sources at once: “Select every event involving people who held an office in the British Government, sorted by date.” A spreadsheet cannot answer that, but a relational database answers it in a single query, however many sources you have gathered.
Note that we only see the first three entities here; further people in the excerpt to be included in this table are Harry Parkes (the Consul), Sir John Bowring, Admiral Seymour, etc.
Table 3 – Role
This table records genuine historical information: which role a person held in which organisation, and for how long. Each row also happens to name both a person and an organisation, which is what lets it double as the connector between the Person and Organisation tables – but unlike the Person–Event table below, it isn’t a real junction table, since the role and dates are meaningful data in their own right, not just a link.
| role_id |
person_id |
org_id |
title |
date_from_value |
date_from_precision |
date_to_value |
date_to_precision |
| RO001 |
P001 |
O001 |
Director |
|
unknown |
|
unknown |
| RO002 |
P002 |
O002 |
Premier of England |
1857 |
before |
1857 |
after |
| RO003 |
P003 |
O002 |
Minister of Foreign Affairs |
1857 |
before |
1857 |
after |
Table 7. Table 3 – Role of the database.
A note on structuring dates. Historical dates are rarely exact, and a plain text field like “ca. 1853” or “before 1857” can’t be sorted, filtered or compared by a computer – it’s just a string of characters to the software. A more analysable approach splits the date into two parts: a value the software can actually read (a year, or a full date when known), and a precision label from a fixed small vocabulary (exact, circa, before, after, unknown) that records how certain that value is. You lose nothing – the historical uncertainty is still fully recorded – but the value column now becomes something a database can genuinely work with. Historians working with larger or more uncertain date ranges may want to look at the Extended Date/Time Format (EDTF) standard, which offers a more comprehensive vocabulary for precisely this problem.
Table 4 – Place
| place_id |
name |
is_region |
is_country |
is_city |
source_id |
| L001 |
India |
TRUE |
TRUE |
FALSE |
S001 |
| L002 |
England |
FALSE |
TRUE |
FALSE |
S001 |
| L003 |
Canton |
FALSE |
FALSE |
TRUE |
S001 |
Table 8. Table 4 – Place of the database.
Why do you think there are three separate columns to specify the type of place? Why not only one?
A note on the type column. A single field should always hold one clear, unambiguous value – the same principle that makes primary keys work also applies here. Writing “Region / Country” into one type cell bundles two separate facts together, which makes the column hard to filter or count reliably (should a query for “all countries” also return this row, or not?). A cleaner approach is to give each possible category its own column, with a simple yes/no (Boolean) value, so that a place can belong to several categories at once without ambiguity. If the number of categories is likely to increase, an alternative would be to use one type column and list the possible values in a controlled vocabulary – but note that this goes beyond the scope of this lesson.
Table 5 – Organisation
| org_id |
name |
type |
source_id |
| O001 |
East India Company |
Trading company |
S001 |
| O002 |
British Government |
State authority |
S001 |
| O003 |
British Parliament |
Legislative body |
S001 |
Table 9. Table 5 – Organisation of the database.
Table 6 – Event
The Event table is the connecting hub.
| event_id |
name |
date_value |
date_precision |
place_id |
org_id |
source_id |
| E001 |
Exposure of torture system in India to Parliament |
1853 |
circa |
L001 |
O003 |
S001 |
| E002 |
Lord Mayor’s banquet – Palmerston’s speech |
1857 |
circa |
L002 |
O002 |
S001 |
| E003 |
Arrest of sailors aboard the Arrow |
1856-10-08 |
exact |
L003 |
O001 |
S001 |
Table 10. Table 6 – Event of the database
Table 7 – Person–Event
The Person–Event table is the junction table.
| compos_pers_ev_id |
person_id |
event_id |
role_in_event |
|
| PE001 |
P002 |
E002 |
Speaker (as Premier) |
|
| PE002 |
P001 |
E001 |
Director (respondent) |
|
| PE003 |
P003 |
E002 |
Attendee (as Minister of Foreign Affairs) |
7 |
Table 11. Table 7 – Person–Event of the database
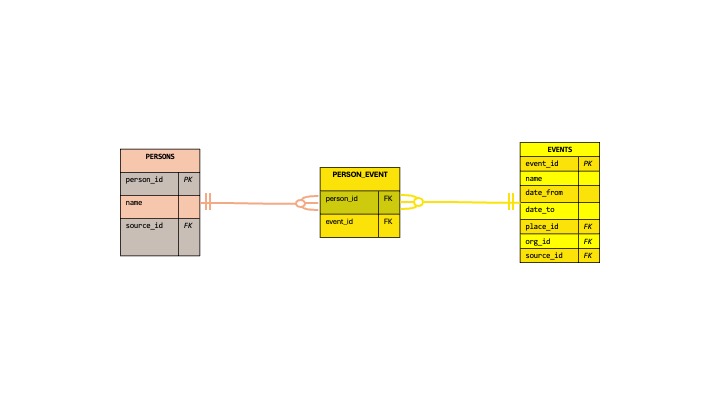
Because one person can participate in many events and one event can involve many people, this relationship is many-to-many – it cannot be stored in either the Person or Event table alone. The junction table holds one row per person–event pairing. Both person_id and event_id are foreign keys; together they form the primary key of this table (a composite primary key), because what is unique here is the combination – the same person can appear in multiple events, and the same event can appear across multiple persons, but a specific person can only be linked to a specific event once.
A query is simply a question you ask the database in its own language – usually SQL, though the concept matters more here than the exact syntax. For example, you could ask: “Who was present at the Lord Mayor’s banquet?” and the database would select all rows where event_id = E002, returning P002 and P003.
Now we have a very basic architecture of a database containing several different types of tables that are related to each other (much like hyperlinks in a web document, but more powerful and flexible). A visual representation would look something like this:
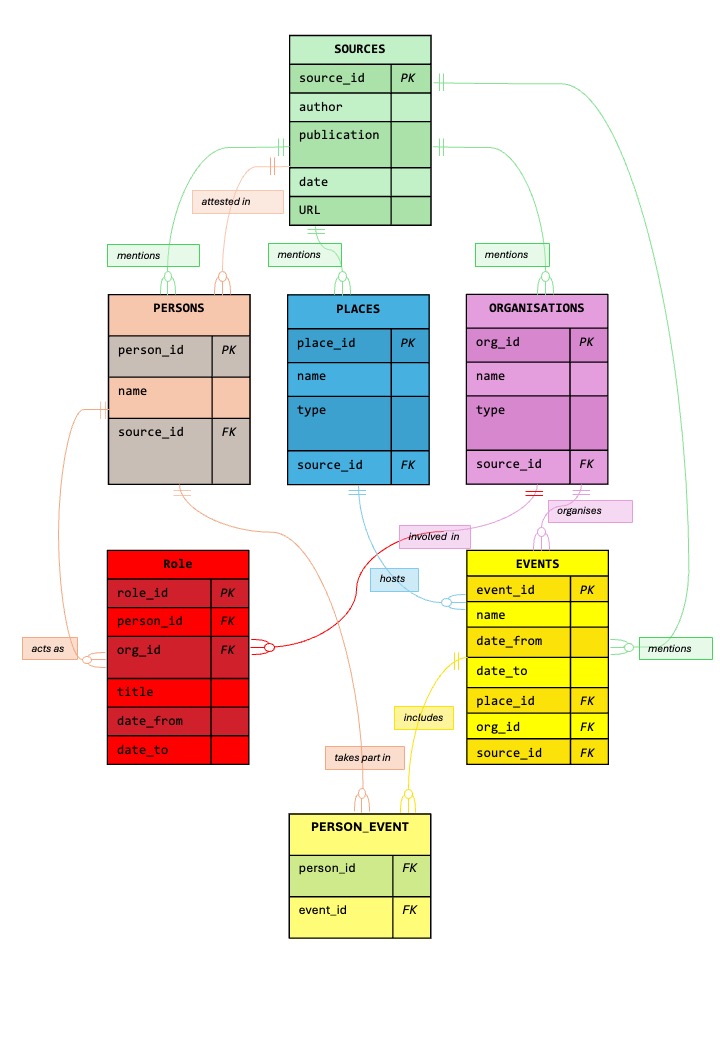
Figure 10. Scheme and connections with description.
Reading the diagram: cardinality and optionality. Every relationship line carries two pieces of information at each end: cardinality (how many – a single bar means “one”, a crow’s foot means “many”) and optionality (whether it is required – a bar means “must exist”, an open circle means “zero is allowed”). Take Source–Person: the bar next to Source means every Person must belong to exactly one source (mandatory); the crow’s foot next to Person means one source may be linked to many people – or, in principle, to none at all if a source names no individuals (optional). Wikipedia uses the same three symbols: ring = zero, dash = one, crow’s foot = many.
| Symbol |
Meaning |
\|\| |
exactly one (mandatory: minimum 1, maximum 1) |
o\| |
zero or one (optional: minimum 0, maximum 1) |
\|< |
one or many (mandatory: minimum 1, maximum many) |
o< |
zero or many (optional: minimum 0, maximum many) |
Table 12. Relationship contraints.
| *Reading rule: the symbol placed next to an entity’s name describes that entity’s multiplicity per one instance of the entity on the other end of the line. Example: Source |
|
⋯ o< Person reads as “one Source may be linked to zero or many Persons; every Person belongs to exactly one Source.”* |
Comprehensive relation type overview
| Relation type |
Notation |
Example |
| One-to-one, optional (0,1 – 1,1) |
Person o\| -- \|\| WikidataEntry |
Not every Person in our dataset has (yet) been linked to a Wikidata entry, but once linked, one Wikidata entry corresponds to exactly one Person. |
| One-to-many, optional many (1,1 – 0,N) |
Source \|\| -- o< Person |
One newspaper article may name zero, one or several people; every Person record belongs to exactly one Source. |
| One-to-many, mandatory many (1,1 – 1,N) |
Organisation \|\| -- \|< Office |
An Organisation only enters our database because at least one Office (a role held within it) was recorded; the same Organisation may have many recorded office holders. |
| Many-to-one ((mirror image of the row above) |
Office o< -- \|\| Person |
Many Office records can point back to the same Person – Palmerston alone accounts for two (Foreign Secretary, then Prime Minister) – but every single Office record belongs to exactly one Person. |
| Many-to-many, optional both sides (0,N – 0,N) |
Person o< -- o< Event |
One person can take part in many events, and one event can involve many people – captured by the Person–Event junction table. |
Table 13. Types of relationships.
One-to-many and many-to-one describe the same relationship from two directions. Looking from Source to Person, one article can mention many people (one-to-many); looking from Person to Source, every Person record belongs to exactly one article (many-to-one). It is the same arrow, just read from opposite ends – which is why you will sometimes see the identical relationship labelled “1:N” in one textbook and “N:1” in another.
A note on scaling to many sources: The table design shown above works well for a source-centred approach, where every Person, Place and Organisation simply points back to the one source they came from. But imagine building a database from a whole corpus – say, 500 newspaper articles about British foreign policy. Lord Palmerston would then be mentioned in many different sources, not created by one. Giving a Person a single source_id column would force you to either duplicate Palmerston’s row for every article he appears in (defeating the whole purpose of deduplication described above) or arbitrarily pick just one source to “own” him. The correct solution is a junction table, which we will refer to as Mention, which records every time a person is named in a source, while the Person row itself stays unique.
Mention Table (Person ↔ Source junction table)
| mention_id |
person_id |
source_id |
| M001 |
P002 |
S001 |
| M002 |
P002 |
S045 |
| M003 |
P002 |
S078 |
Table 14. Mention table (junction table).
Palmerston (P002) still exists only once in the Person table but now appears in three rows of the Mention table, making this a many-to-many relationship between Person and Source.
However, a database is subject to good old source criticism too: entering a piece of information from a source into a table does not make it any more certain or reliable; it still needs to be critically evaluated for provenance, perspective and credibility. But uncertainty can be integrated explicitly into the data model, as we did in the case of the date, for instance. The fundamental principle of all historical research must always be critically engaging with any source material, whether digital or not, rather than considering information found in historical sources as solid facts!